California Ajax Solutions Team
www.CalAST.com
DynaCRUX Report Generation System
Introduction
This article describes DynaCRUX, an extension of the basic CalAST Report Generator software that adds many new features. DynaCRUX stands for Dynamically Create Reports Using XML. The original CalAST report generator design is described here.
While report generators are common in desktop systems running Windows and MacOS, similar software for mobile devices or Linux is less available and generally less complete. The purpose of the new design is to provide a platform and browser-independent reporting facility for use in database-driven web applications. While not as full-featured as commercially available software, DynaCRUX provides a good deal of functionality that web application designers might like to provide to their customers and management team. For many such applications, DynaCRUX is sufficient, and it can be easily extended to add new capabilities.
DynaCRUX is a work in progress, but is fully operational. This document is a "white paper" that gives a somewhat technical overview of the software. Alternatively, you may learn more about it by reading the DynaCRUX User Guide, which takes you through an example of building a report and all its support files.
A very brief overview of the implementation suggests the minimum requirements. First, DynaCRUX is a web application that runs in your browser - or, at very least, uses your browser as a user interface. Like most web apps, it has a client side written in JavaScript and a server side, here written in PHP. So, your server must have a reasonably up-to-date version of PHP running. DynaCRUX achieves its database-independent nature through the use of PDO (PHP Data Objects). Thus, your PHP installation must have PDO installed with an appropriate driver for the database in use.
Design Goals
The obvious next question is "What does this software do?" Given a database-driven web application, it is useful for the users of such an application to easily pull reports from the database that extract information in a reasonably understandable form. These can be management reports, activity reports, financial reports, or virtually anything that a user of the database might want to know. For example, a company might allow their customers to generate their own reports, freeing up in-house personnel for other tasks.
In general, the following capabilities are desired.
- A report definition can be stored on the server or in the database itself and retrieved at run time, so it does not need to be specified at every run.
- It should also be possible to define and run a report without saving it, if it is a one-time requirement.
- There should be some user-friendly mechanism for defining and editing reports.
- Every run of the report will be somewhat different, so there need to be run time controls that collect specific information about this run (e.g., a date range) that are used in retrieving information.
- There should be grouping and sorting capability, as well as specifying which fields to include.
- While the retrieval provides the "data answers" to the user's question, some presentation options make the data easier to understand.
- While not required, it is useful to provide standardized reports that are run by all users, and which can be hard-coded.
- For fields that are not actually in any database table, it should be possible to define "macros" that allow such data to be obtained by synthesis, subqueries, or whatever technique is needed. In DynaCRUX, we call these synthetics.
- The user should be able to define standard filters, which should be referenced by name to prevent SQL injection attacks.
- The entire system should be template-driven, so that client and server code remain synchronized as the database changes.
- Report data can be exported to a spreadsheet for further manipulation.
The original report generator software addressed many of these needs, but required a great deal of synchronization. It also had some performance issues due to the nature of the implementation, which sacrificed speed for flexibility. It had no run-time control capability.
The synchronization issue is important, and is best understood in terms of how the software works. Two programs are required. On the client, a GUI (Graphical User Interface) is used to specify which fields are of interest, and which records to retrieve. On the server, a separate program interprets the request and does all the data retrieval. But the fields available always have to be the same in both sides of the program. Adding a new field to the database (and, implicitly, to reports) requires modification of the client side to specify a new item that could be used in a report definition, and the server code has to be taught how to retrieve that data.
While this will always be an issue (one cannot ask for non-existent table fields), DynaCRUX uses a template to drive both sides of the program, and thus to keep both programs "in sync." The template data can be retrieved by the client-side GUI code to build a suitable user interface, and the server can use it to figure out how the data is to be retrieved. The use of templates is one of the major improvements in DynaCRUX, as it greatly reduces the amount of code that needs to be updated as the data changes.
System Overview
To understand how DynaCRUX works, it is helpful to consider how a report is run. We will assume that a report is already defined and stored in the database or on the server file system. Defining and editing of reports is a separate issue, but almost any XML editor could be used. (A template-driven user interface is more useful, of course.) In general, the steps are as follows. Remember that the client side runs in a browser.
- Retrieve the report to be run from the server by whatever means is appropriate. Reports generally have names, and may be stored in the database itself, but this is not required. Most of the time, reports are stored on the server's file system.
- Examine the report specification to see if there are controls. If so, create corresponding controls in the client-side GUI to prompt the user for this run-time information.
- When the user has filled in any controls and is ready to start retrieval, pass the control values to the server along with the report specification. This is only part of the report definition, as will be explained below.
- The server will use this specification and the values of the controls to extract information from the database, sort it, and return the answer to the client.
- Several output formats are supported. The server code can generate a web page and return that to the browser for display. Or, you may store your own web pages on the server and have DynaCRUX "fill in the blanks" by writing the report data to a named DIV in your page. Alternatively, you can request that the server create spreadsheet-compatible output, which you can then download to the client machine.
Of course, running a report is only a small part of DynaCRUX.
Like all systems that provide power and flexibility, some degree of complexity is required. The user interfaces are designed to simplify things to some extent, but the system administrator will need to have a general understanding of how DynaCRUX works. A good place to start is to note that DynaCRUX is based on two types of files, both stored as XML. The template file represents the database itself, or more specifically a view of the database from a reporting perspective. An implementation might have more than one of these. For example, a company might wish to allow its partners (or even customers) to generate their own reports, but not to be allowed to "see" any financial information in the database. This is easily addressed by having different templates for internal and external use. We will discuss templates in greater detail later on.
A report file determines what a specific report looks like. It is based on a template, and thus information in a report is restricted to only that which the template allows. You might have a database with fifty or more tables, but only a few are really useful for reporting. By restricting tables in the template, defining a report is made much simpler. Deciding what to include from a list of every column in fifty tables is a nearly overwhelming task. Report files define data to be presented in a given report, and allow for such things as run-time controls to narrow down the scope of things. For example, you might wish to run an inventory report and specify at run time that you want inventory as of the last day of a selected quarter.
In addition to these files, DynaCRUX includes web-based applications to create and edit the files, and to run the reports. The user may choose to create his or her own web apps to better suit the needs of the system being developed, but the ones bundled with DynaCRUX provide a good starting point. Here is an overview of the DynaCRUX system:
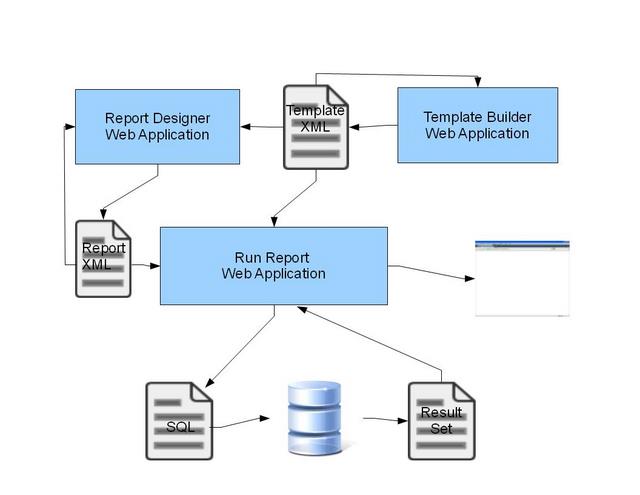
We note that running a report uses both the template and report XML files. Each file type has its own interactive editor/designer application, and the run report app performs the operations described above. It should also be mentioned that two or three separate machines are involved in this process. The client machine provides the user interface for all applications, the web server runs the majority of the access code (written in PHP), and the database server executes the queries and returns results to the web server.
Report Structure
Let us now return to the report definition itself. The function of the report is to describe how to generate one or more queries against the database and present the result sets in some meaningful way. Consider a generic SQL query:
SELECT item list FROM table list WHERE filter conditions ORDER BY order specification GROUP BY group specification
DynaCRUX builds such a query from the information in the report file. We will now look at each of the non-keyword parts of the query and see how they are expressed in a report.
The item list is stored in a very straightforward manner. Each result set in the report contains retrieval information that lists the items to be used in the SELECT statement. These items are based on what DynaCRUX calls the xmlname - that is, some unique identifier that is legal in XML. The xmlname is an identifier, and simply specifies an item described in detail in the template file.
The table list is built using the tables associated with the objects in the item list. It also understands table relationships used to build JOIN statements, because the template defines such relationships.
The filter conditions are derived from controls. These are either design-time controls from the template whose values are specified in the report definition, or run-time controls with values specified by the user each time a report is run. We use the terms filters and controls more or less interchangeably in DynaCRUX, but the control is really a GUI representation of a filter and the filter is itself a SQL expression.
Order specification is determined by examining any sort attributes associated with the items in the item list. Internally, items are stored as a fairly complex object that contains all the information needed for both retrieval and presentation. The XML version in the report file is similar. Group specification, if used, is similarly contained in the item description.
In the Report XML Structure section, we will see how these are really represented.
Grouping and Sorting
One of the more difficult ideas in DynaCRUX and its predecessor seems to be the difference between grouping and sorting. In fact, most of the difference between grouping and sorting is in the presentation phase. However, it will always be the case that grouping takes precedence over sorting, and becomes the "primary sort" with sorting (or ordering) coming later. We will use the wine list example to clarify things.
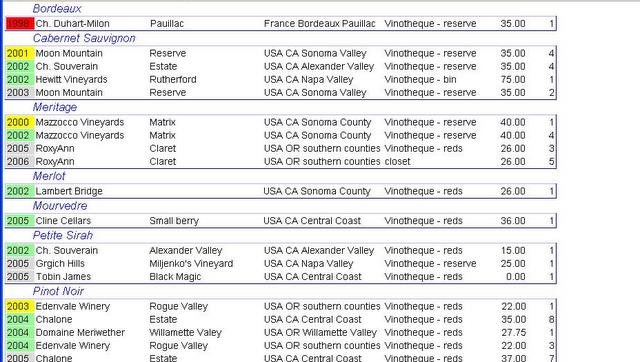
Here we have a "restaurant-style" wine list. The varietals (Merlot, Pinot Noir, etc.) are used as groups. Not only are they sorted first, but note that the name of each varietal appears only once as a heading. In contrast, the vintage year is used in sorting but is not used for grouping. The name of the vintner is also a sort term. So if you look at the Pinot Noir part of the table, you will see that the years are in order, and three of the wines are from 2004. The vintage year is repeated - every line has the vintage year displayed. Within each vintage year, the vintner names appear in alphabetic order, so this was also part of a sort. And, as with vintage year, they appear in every line of the table. The repetition of the information is a clue that this was an "order-by" term, rather than a "group-by" term.
Again, this is primarily a presentation issue, although it does imply that groups are the first sort terms. In technical terms, the generated SQL would include something like ORDER BY Varietal, Vintage, Vintner.
Report Definition
Ideally, the Report Builder app is used to define the report, as it can be easily constrained to only those fields that are meaningful to retrieve. It is also guaranteed to produce a syntactically-correct output file. A field is not restricted to something that is actually in the database, as you sometimes will want to retrieve something that does not have a specific table and column name, or you might wish to retrieve a named group of fields. The template definition understands how to address this problem, and we will discuss this further in a later section.
Here, we just wish to present an overview of the standard web-based DynaCRUX GUI to show what is possible. If you are designing a web app, you might write your own report definition software. All that is necessary is to somehow come up with a report definition in XML that represents what you wish to see. This could even be done in a text editor - though this is not for the faint of heart.
While the user guide is really the best way to understand the GUI, an overview of what it does is perhaps helpful in understanding something of the report definition. We like to consider this a sequential process, somewhat like preparing your tax return using computer-based software.
As noted, a report consist on one or more datasets, or result sets. It also has a good deal of information that applies to the report itself, so we acquire this first.
In this "report info" phase, we collect information about the template on which the report is based, the file containing the web page used to display the report (if not using the default one), the optional report title, and style sheets to be added to the web page. We then look at run-time controls and filters, which are defined in the report file. You can add new ones, or modify existing ones if you are editing a report. Finally, we let you define local variables known only in the report file itself. These are restricted to synthetics for now.
Report Builder then enters a loop, letting you define one or more result sets (datasets). For each dataset, you specify what format is used (table or list) and where in the web page the dataset is to be written. You also specify filters that apply to this dataset, so they can be used in building a WHERE clause. Finally, you select which items from the database (or synthetics) you want to include in the report.
Once you have selected all the items to be retrieved, you can specify how the results should be presented. This includes sorting, grouping, order of items in the output table or list, and space allocation for table columns. You can also request a function (sum, count, min, max, etc.) be applied to a column of a table, with the result written to a summary line appended to the table.
When you have completed work on a result set, the code loops back to give you a choice of adding another result set or finishing up.
Once all this information has been collected, the report may be either saved as a report XML fie, or it may simply be run as a one-time report.
Report XML Representation
The report itself is represented as an XML file containing several sections that provide the information needed to build the query, as well as information on how to present the results.
- Template specifies the name of the template from which the report is derived (required)
- Page specifies the name of a web page stored on the server to which the output is directed (optional)
- Title specifies information about how the title of a report is to be presented (optional)
- CSS specifies a list of style sheet files used to build the report (zero or more)
- Controls defines run time controls used in the report (zero or more)
- Variables contains any local variables used in the report. At present, these are restricted to local synthetics (zero or more)
- Dataset defines a result set that indicates what is to be retrieved and how it is to be presented (one or more)
So, a minimal report would consist of only the template name and the specification of a result set. Of course, this is itself a fairly complex structure. Before we move on to that, let us discuss controls.
As a general rule, controls will result in the generation of GUI elements that are stored inside a form presented to the user during the first phase of running a report. The form is then posted (possibly using Ajax techniques) to the server to pass the user-supplied values along with the retrieval specification. Suppose you wanted to retrieve a list of wines (my favorite example) from only one country, but you wanted to specify which country at run time. You could include a radio button group control in your report specification, with buttons for France, Italy, USA, Australia, etc. This would then be displayed to the user at run time, and you would make sure one was selected (or specify a default). The selected value would then be passed to the server during the data retrieval phase.
In the data retrieval phase, the "dataset section" of the report definition is used by the server to build SQL. The SQL query is then executed to retrieve results from the database. So, what does the dataset section look like?
- Type specifies presentation information for the dataset itself - at present, table and list are the only choices
- Div specified an HTML DIV element where the results are to be written
- Globalfilter specifies zero or more filters to be used in building the WHERE clause
- One or more Items to be included in the dataset must be present
Clearly, type and div have to do with presentation more than retrieval. Items include information about both retrieval and presentation, and are themselves complex.
- Xname specifies the unique XML-legal identifier for the item.
- Sort specifies any information used in building the ORDER BY clause
- Group specifies information used in building the GROUP BY clause
- Column specifies the order in which the item is to appear in the output table or list
- Width specifies the width of a table column
- Colpct specifies a column percentage for space allocation
- Format specifies how the data is to be formatted (text, date, currency)
- Label allows you to override the default display name from the template
- Function allows you to apply a mathematical function to a column of information in a table, to be appended to the table as a "summary line."
Only the first three items really affect generated SQL. The rest are used in building the display.
Now, let's look at a run-time control. These are in the controls section of the report, and cause a display version of the control to appear on-screen before running the query.
Depending on the type of the control, there will be additional nodes that define how the control is to built and what values are allowed. These should always include the <xname> node, but the structure will look different for different controls. Consider the following definition of a simple checkbox control:
<controls>
<control >
<xname>ItemsinStock</xname>
<type>checkbox</type>
<label>Items in Stock</label>
<filter>Quantity > 0</filter>
</control>
</controls>
The control has a unique XML-legal name, a type, a label to be shown on screen at run time, and a filter that defined what is to be places in the WHERE clause if the user has checked the box. Since the '>' character is not legal in XML, we use the escape '>' to represent it.
Now, we will look at the information about retrieval and presentation. Here is the start of a data set, including the first item.
<dataset id="dcxPDS">
<dstype colopt="browser">table</dstype>
<item>
<xname>description</xname>
<sort>2</sort>
<column>2</column>
<format>text</format>
</item>
This is sufficiently complex that a bit of explanation is required. First, the dataset itself has an ID and some type information, indicating that it is to be presented as a table. The colopt attribute tells DynaCRUX to simply let the browser allocate space for the columns of the table.
The dataset node has one more item child nodes. The one shown has a unique identifier (xname), a presentation format, a sort node indicating this is the second item on the sort list, and a column specifier saying it will be the second column in the table. Items can appear in any order, and may have other child nodes or attributes.
Please note that running the queries returns a result set in HTML, where each row contains all the information specified by the <group>, <order>, and <item> terms. It is also possible (and sometimes quite useful) to return one or more values that correspond to the report itself, such as the number of items found. To achieve this, we use named <query> nodes. Again, we must prevent SQL injection attacks, so we specifically disallow the inclusion of SQL in the report specification itself. However, we can use a named object that the server side code understands, just as with filters. So we could add a <query> node with value resultSetSize, if that was a name known to the server-side code. This value would then be returned with the result set so we could display it as part of the report presentation.
Database Template Document
Much of the power and maintainability of DynaCRUX comes from the fact that it avoids hard-coded information wherever possible, and uses templates to build both client and server-side code. Of course, the template primarily resides on the server. However, using Ajax techniques, it is possible to retrieve the template at run time and use it to build a GUI that only presents choices that are meaningful. Since the server-side code includes the template as well, it is highly likely that synchronization can be maintained between client and server without a great deal of programming time. In most cases, the system can then be extended by simply making additions to the template.
You should look at the template as exporting a working definition of the database for reporting purposes. You don't need to describe everything in the database, but you do have to provide enough information to allow DynaCRUX to generate a proper query for data retrieval purposes.
What does the template describe?
- Any object that can appear in a report; objects are described in more detail below
- The tables containing objects that can be used in a report
- The relationships between tables in the database, where necessary for retrieval
- Definitions of named filters and queries
- Controls to be displayed at run time for parameter specification
- Presentation information
Clearly, every database is different, but DynaCRUX attempts to provide a language that can describe fairly complex relationships within a database. The Database Template is an XML document that provides such a description. Note that there is often only one template document per database, but an arbitrary number of XML report documents are possible. This is why these are often stored in the database itself.
Some of the challenges that we faced in designing the template is that a given data object may or may not have an actual representation in the database, and that the naming rules for GUI, data transmission, and database column names may all be different. Thus, the template system must allow for all these possibilities and more.
We will start with the retrieval objects themselves.
Each object that can be specified in the retrieval section has a number of attributes specified in the template. But is is easier to understand them if we first explain the types of these objects that are allowed.
- element - this is an object that corresponds to a column in a database table, and is the most basic object
- synthetic - this object does not exist in a table, but functions as if it did. For example, you might have a status object that can be derived from the contents of three or four actual table columns, given predefined SQL.
- group - this refers to a group of columns that are always retrieved together, with a fixed length. Elements can have a group as a parent, creating a simple hierarchy. The user asks for the group in the report definition, but the report contains all elements which have the group as a parent. All members of the group must be in the same table.
- vargroup - this refers to a group of columns of variable length; that is, you will not know how many columns are returned until run time. These cannot be parents of elements. But asking for the vargroup does result in the report having one column for each member of the group.
Here, then, are the attributes. Any attribute not required is simply omitted. It is not necessary to specify an empty node.
- displayname - what this is called in the GUI
- queryname - what this is called in the database
- xmlname - xml-legal name used in data exchange between client and server
- type - the type of the object
- table - for objects that are in a database table, which table stores this field
- parent - for hierarchical objects, the parent of this object
- format - formatting option for certain types (e.g., phone numbers, currency, etc.)
- sum - for numeric objects (usually elements), causes a sum to be accumulated after retrieval
So for example, we might have:
<object>
<displayname>Order Date</displayname>
<queryname>OrderDate</displayname>
<xmlname>order_date</xmlname>
<type>element</type>
<table>Orders</table>
<format>date</format>
</object>
If the user chose to make this part of a report, then this would result in generated SQL containing something like:
SELECT ...Orders.OrderDate... FROM ...Orders...WHERE ...
Another interesting possibility is that you might wish your reports to contain all the columns in a table as a group, or some set that are always treated as a group. For example, in our wine database, we might have a table of purchases which specify the date, source, price, and number of bottles purchased. (This would also refer to a wine on the master wine list.) If you wanted to restrict the user to always retrieving this information as a group, then this can be specified in XML as follows.
<object>
<displayname>Purchase Info</displayname>
<xmlname>purchaseinfo</xmlname>
<type>group</type>
<table>purchases</table>
</object>
<object>
<displayname>Date</displayname>
<queryname>PurchaseDate</queryname>
<xmlname>purchasedate</xmlname>
<parent>Purchase Info</parent>
</object>
<object>
<displayname>Source</displayname>
<queryname>Source</queryname>
<xmlname>source</xmlname>
<parent>Purchase Info</parent>
</object>
<object>
<displayname>Price</displayname>
<queryname>BottlePrice</queryname>
<xmlname>price</xmlname>
<parent>Purchase Info</parent>
</object>
<object>
<displayname>Quantity</displayname>
<queryname>Quantity</queryname>
<xmlname>quantity</xmlname>
<parent>Purchase Info</parent>
</object>
Requesting a Purchase Info object will retrieve all four objects that have Purchase Info as a parent. Note that you cannot retrieve the Quantity object directly in the above example, since it contains no table information. If a complete specification is provided, then you could also retrieve it separately from its group. But "child" objects in a group don't need a table specification, since they must all come from the table specified in the parent.
Of course, most objects you will wish to use in a report are simple, but it is often the case that more than one table will be involved. In such a case, the server code must also understand the relationship between the tables. The server-side code must note which tables are used in the retrieval request, and build a FROM clause with JOINs dynamically in response. This is necessary to allow you to retrieve information from tables other than the primary one, but only where fields match.
Table relationships are managed in the tables section of the template. Going back to our wine list example, we wish to have a base table that relates to other tables in the database. But the wine list table is the "heart of the system" in some ways. Not all databases are designed this way, but it is useful to specify such a base table. Here is the definition:
<table>
<name>winelist</name>
<key>WineListID</key>
<references foreignkey="VarietalID">varietals</references>
<references foreignkey="VintnerID">vintners</references>
<references foreignkey="LocationID">locations</references>
<references foreignkey="RegionID">regions</references>
</table>
The template definition of the table specifies its database name, the name of the primary key if present, and notes that four columns are foreign keys that reference other tables. The tables that they reference are the values of the references node. Attributes are used to specify the column name in the winelist table that contains the foreign key. Note that we do not need to specify the names of the primary keys of the other tables in this example, since by default it assumes the primary key is used. Also, we don't specify the names of all the columns in the winelist table. Any columns we wish to use in reports are contained in objects.
There are many more types of relationships possible in a database. In the above table definition, the base table references other tables. But other tables (e.g., purchases) can have foreign keys that refer back to the base table in a many-to-one relationship, and it is not uncommon to have relationships that reference something other than the primary key of a table. All these possibilities can be specified in the template document.
Presentation
There are many ways that database contents may be presented to provide useful information to a web application "operator" in any role.
- Management will often want information on the status of orders, jobs, customers, etc.
- Customers may have reporting requirements for their own management teams.
- The system may be used to produce invoices for customers
In truth, the list of possible reports that people may wish to run is practically endless, and changes with some frequency Thus, flexibility in specifying reports (both one-time and recurring) is key. But it is also necessary to produce reports in different formats. For example, a list of all the inventory items that are currently out of stock is probably best presented as a table. But a customer invoice is much more complex, having sections for billing address, work or product line items, totals, terms, invoice numbers, etc. Besides, you will probably want your company logo as part of an invoice.
Many database front ends (e.g., Microsoft Access) provide this capability, but databases built without such a "wrapper" will not provide much in terms of report generation. Even where provided, it may not meet a company's needs. Thus DynaCRUX is designed to give the user control of how a report looks.
Since DynaCRUX is itself a web application, it renders its reports to a web browser. Once there, the browser's built-in print capability is used to make paper copies of a report. Or, if there is a PDF printer driver installed, the report can be converted to that format and saved.
But sometimes the user just wants to save the report on a local hard drive for further manipulation. Most commonly, this would be done by a spreadsheet program, and DynaCRUX has the ability to export data in either CSV (Comma Separated Values) form or XML form for importation into a spreadsheet program.