California Ajax Solutions Team
www.CalAST.com
Chapter 6. The Report Builder Application
In this chapter, we will show you how the DynaCRUX interactive Report Builder is used to create a report for you to run as an instant report or to save for future use. We will use our improved wine list report from Chapter 3 as an example, but we will also show you other features that it does not use.
Report Builder runs as a client-server application on two systems. Mostly, it runs on the client side (your machine) in the browser as JavaScript code. It does need to communicate with the web server, because that's where the template and report files are stored. The structure of the application is based on the structure of the report file. It first works on information that applies to the entire report, then it loops through the datasets one at a time to collect or modify information about those. Of course, if you have only one dataset, the process appears more linear.
Like the Template Builder, the Report Builder application can also be used to edit an existing report. It all depends on how it is run from the main switchboard (or your web application). If you specified that you wanted to edit a report, then the switchboard takes you to another page (ReportBuilder). DynaCRUX assumes that any report you want to edit is located in the Reports directory on your web server. So if you ask to edit a report, you will be shown a simple form with a drop-down list of all the reports in that directory. Choose one and click on Edit Report to invoke the Report Builder app. If Report Builder sees "action=edit" and the report name on its URL invocation, it will load that report from the server and build internal data structures for you based on what you chose when you created the report. You can then modify the report or build another report from it (or just run it).
Of course, instant reports are not saved in the Reports directory. If you want to create and run a report to get a quick answer, then instant reports are just what you need. These are stored on the server in the uploads directory.
Report files are XML documents, like templates. They tend to be somewhat shorter, since they reference objects in the template rather than repeating information about those objects. While XML files are just text and can be edited easily, we strongly recommend that you use the Report Builder app. It understands the meaning of report file contents and tries to prevent you from creating a report file that won't work. The content of report files is explained in Appendix B if you really want to understand their structure.
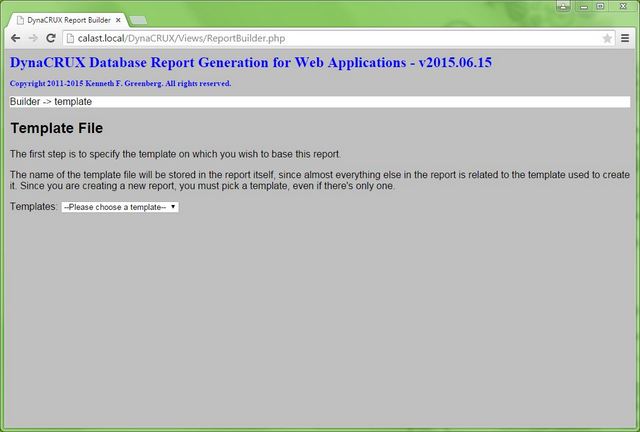
Template Selection
Reports are always associated with exactly one template. So the first thing Report Builder has to know is the name of that template. Once you tell it which template you wish to use, then it knows how to present you with choices - because those choices are defined in the template file.
If you are editing an existing report, then it already knows the answer and skips this step. You can't change the underlying template for a report to a different template. It is also true that if you built a report from a template and then edited that template, the report may contain information that is no longer valid. For example, you may have deleted or renamed something in the template that had already been referenced in the report file. The Report Builder compares the dates of the two files for you and warns if the template is newer than the report being edited. But it can't figure out how to adjust the report file to compensate for template changes. The intent here is that templates change infrequently, although this is probably untrue when you are first building a system. The warning only points out that you need to look at what has changed in the template, and how that affects the report being edited.
If you are creating a report from scratch, then you have to tell it which template to use. When Report Builder starts, it presents you with a drop down list, which prompts you to make a choice of template files. Choose one from the list of templates in your Templates directory on the server. For example, if you have a Customer template and a Staff template to control information access, choose the one of interest for the report you are designing.
.
You are probably wondering how information can be restricted if everyone gets to choose which template to use. In general, only your staff will be able to make such a selection. You can let your customers use Report Builder, but you must limit their template choices.
We will start out by selecting the generated wine list template from the last chapter. Once you have chosen a template, it is retrieved from the server and used to determine what choices will be made available to you while working on the report.
Filter Selection
The first thing that Report Builder works on is the controls section of the report. These are run-time controls, not the ones defined in the template. Remember, controls and filters are different aspects of the same thing, so we use the terms somewhat interchangeably.
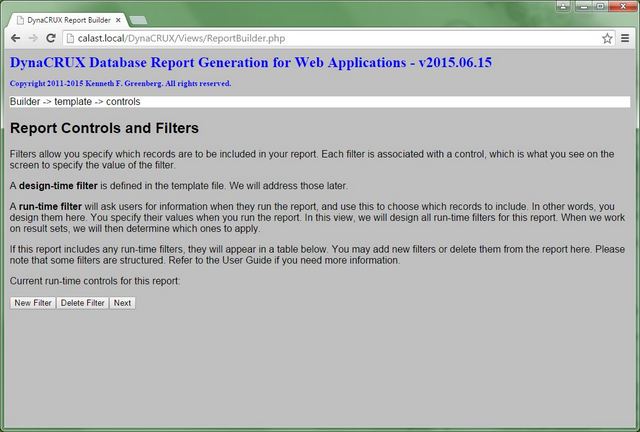
The design-time controls in the template can be used in any report you design. In this view, we define new filters that just apply to this report. These are called run-time filters, because you specify the value to be used in reporting when you run the report. To clarify the distinction between these two filter types, please consider the following.
| Design-time Filters | Run-time Filters | |
| Stored | In template file | In report file |
| Displayed | In Report Builder | As part of run time user interface |
| Defined | In template builder | In Report Builder |
| Filter information | Known at time template is built | Known when designing report |
| Value | Specified in Report Builder | Values provided by user as part of running report |
If you want to add run-time filters, Report Builder can help you do that here. If you are editing an existing report, Report Builder will show you a table of all the filters already stored in the report. You can delete filters or add new ones. Since run-time filters are fairly complex, you have some choices to make.
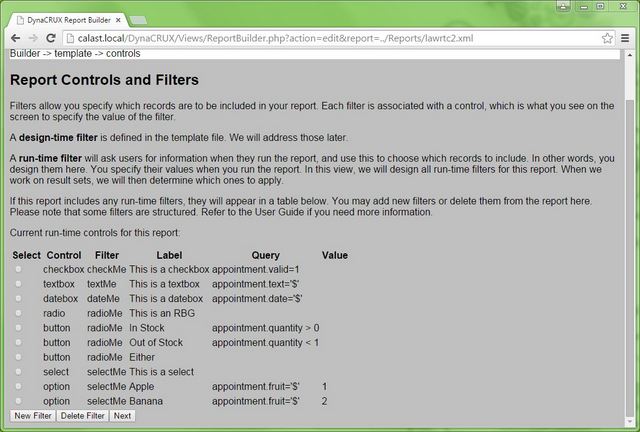
For existing run-time filters, you are presented with a selector table - that is, one with radio buttons in the first column instead of a check box. This lets you choose an existing filter and delete it from the report. The table you see on screen is a list of all the included filters. When you delete one, it is removed from the table. When you add one, it is added to the table. Here is a test file with a number of existing run-time filters of various types:
You use New Filter to add both entirely new filters to the report and to add new options to structured filters that already exist. If you want to add a new radio button to an existing radio button group, just make sure the name matches the group name in the table (type radio) and specify your new button. Drop-down list options work the same way. If the name of the "parent" (the radio group or drop-down list) matches, then any new "child" is added to that group. They may be out of order in the displayed table, but they will be correctly associated in the output file.
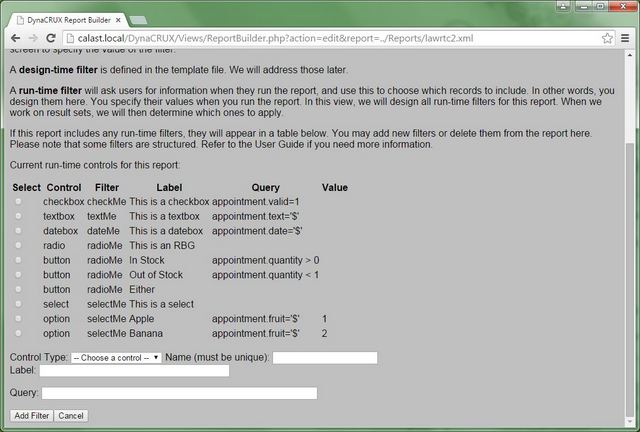
You must always choose a control type and Name. Since the information we need to collect is different for various control types, the form will change when you make your selection.
Let's start with a simple example. A checkbox is one of the most basic controls. When you click on New Filter and choose checkbox from the drop-down list of control types, the form will adjust to acquire the three other items DynaCRUX needs to know: the internal name of the control, the display text that appears on the screen, and the associated SQL query. You just fill in the form to provide this information and click on the Add Filter button.
A structured control is a bit more complex. It is assumed that the user knows all the information about a structured control up front - and will enter the control information that way. (Of course, we realize you may change your mind, and we will address this in a minute.) For example, suppose you wanted to create a radio button group to choose items based on stock level. You start out by clicking on New Filter and selecting Radio Button Group as the type. You will be asked for the internal Name and the display text for the group as Label. You are expected to add the first button at the same time you create the group. You fill in the display name of the button as Button Label, and the SQL Query associated with the button. For example, the button labeled In Stock could have the query appointment.quantity > 0. Note that there is no query associated with the group itself - and we disable that input so you can't enter one.
When you click on Add Filter, two items are added: the radio button group and the first button. Now, click on New Filter again. The application remembers that you were adding a radio button group, so it will still be selected. Also, the name of the group is still filled in. So, you are essentially ready to add the second button. Enter the button label (Out of Stock) and the button query (appointment.quantity<1). Click on Add Filter and a second button will be added to the existing radio button group. Now, repeat the process and add a third button with the button label Either, clearing out any text from the the query box. In this case, you don't care about the quantity, so you don't need any SQL to specify this. When you click on Add Filter, you will see a confirmation box asking you to confirm that you really meant to not have a query. Click Yes and the third button will be added to the group.
What happens if you added other controls and then decide you need another choice for one of your groups? Let's add a new select option to the existing group selectMe.
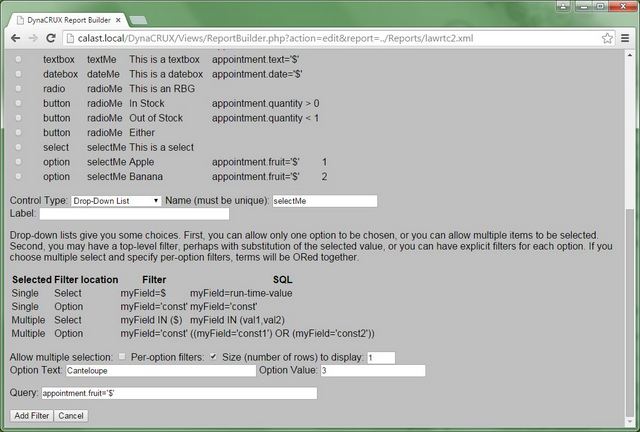
When we chose Drop-Down List, the option information was added to the form. We don't need to enter a group label since this is an existing select control, but we do need to specify its name. We then add the option label and query. When you have filled out this information, just click on Add Filter to save the new option.
Deleting a filter works in a very straightforward way. You just pick the filter you wish to delete from the report by clicking on its select radio button, then click on Delete Filter. It will then disappear from the table. Note that deleting a structured control type (radio button group or drop-down list) deletes the item and all of its "children." When you have finished with all your changes, click on Next to move on to the next screen.
Now, let's take a look at how filters can be used in a report. Suppose you had a law office and you recorded all meetings with clients. You would like to get a report of all meetings that happened during an arbitrary time period - a week, a month, during a specific two-week period, etc. The report would always be the same, just the time period would be different.
The solution here is to define two run-time controls (and their associated filters - remember that a control and a filter are just different aspects of the same thing). You define a start control and an end control representing dates. When the report is run, these show up as part of the web page that does the actual run. The user fills in the starting and ending dates in some known format, and runs the report. Data is filtered by applying the limits entered by the user.
DynaCRUX supports several types of run time controls at present. These were discussed in the previous chapter. To review:
- Checkbox controls allow you to define a filter and ask the user at run time if that filter should be included or left out
- Textbox controls prompt the user for some text information, like a name. The value typed in will become part of the query
- Datebox controls are textboxes with a calendar overlay to help you get the format right
- Radio button groups allow you to select one of a mutually-exclusive group of choices
- Drop-down lists allow you to select one or more options from a list of choices
While checkbox controls don't have values - they only determine if the filter is included or not - most other types do. How are the values used? For textbox-like controls (including dates), your filter must contain a "$" symbol that will be replaced by the control value at run time. Here's an example. Let's define an afterdate control. The SQL for this will be:
appointment.date>'$'
Whatever date is entered by the user is simply substituted for the "$" in the query. Remember that checkbox controls don't do substitution, though. So you should never use a "$" in your filter if the type is checkbox. You probably will always use a "$" to substitute a run-time value in textboxes and dateboxes, and drop-down lists.
We do leave it to you to provide queries that make sense. You should have a good basic understanding of SQL syntax before writing a query. For example, you need to know that something that produces a single value like a textbox can be used in comparisons like name='$'. But something that can produce multiple values (like a drop-down list) needs to use the IN operator - e.g., language IN ('$'). When the user specifies French and Italian, DynaCRUX knows to substitute as language IN ('French,'Italian') at run time.
Radio button groups are a bit different, in that they don't normally produce a single value. So instead of having one query for the whole group with value substitution, each button gets its own query. As an example, your law office appointment report might have a choice of appointments where attorneys were present, appointments where no attorneys were present, or all appointments. So we could implement this with three buttons as follows (a bit simplified, since it assumes only one employee attended).
| Button Label | Query |
|---|---|
| Attorney Present | role.Class IN ('Partner','Associate') |
| No Attorney Present | role.Class IN ('Paralegal','Admin') |
| Any |
Note that the "Any" case simply does not have a filter, so all appointments would match.
You can use this for drop-down lists as well, since each list item gets its own filter. In HTML terms, this is a select with various options, each of which is associated with a filter. The Report Builder assumes you will define drop-down list options this way. Here, we also add a bit of versatility to allow you to come up with a solution that best meets the needs of your database design and customers.
Even though each option has its own filter, you can still take advantage of $ substitution. HTML select options can have a hidden value, along with the text that you see on the screen. So do the DynaCRUX objects associated with them. So you could define a drop-down list with an entry that says "Banana" on the screen and associate it with the value 2. When DynaCRUX encounters a "$" in the filter query, it looks to see if there is a value to substitute. If so, it uses the value (2), but if not, then it substitutes the label (Banana) for the "$" in the query. Please note that this is consistent with the way most browsers work. That is, the value of a select option is its on-screen representation, unless you tell it otherwise.
Of course, you always have the option of not using substitution at all, and just explicitly coding "fruit='Banana' in your filter.
For our wine list report, we don't have any run-time filters, so we just used a filter test report to show you the possibilities.
Local Synthetics
A local synthetic is a SQL expression to which you assign a name, an on-screen label, and a query. Of course the query must be correct, and that is the designer's responsibility. But this feature provides a way to include data that may only be needed one time (as in an instant report) and that was not defined in the template. Unlike the synthetics in the template file, local synthetics exist only in the report file. They are in the Variables section of a report file, which we build or edit here.
There is a separate screen for creating and editing local synthetics, and it must come before specifying items to be included in the datasets - so they can be chosen for that purpose. If you are creating a report from scratch, there won't initially be any local synthetics. If you are editing a report file that does have local synthetics, then the existing ones will be displayed.
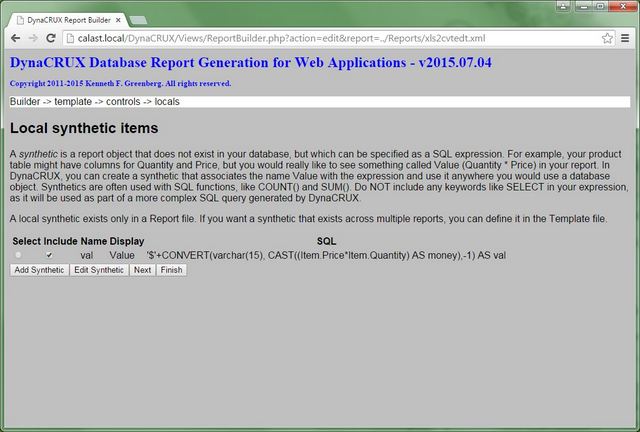
Here, we see that there is a table of local synthetics. It has radio buttons, so you can choose one to be edited. There is a checkbox to indicate that you want to keep this when writing the output report file. It shows the name (which must be a unique identifier), display text that will become the column heading, and the query itself. Note that unlike the synthetics in the template file, you don't specify a table. The query must include this information.
Now, suppose you want to add a new local synthetic. Clicking on Add Synthetic brings up a form for you to do so. Fill in the information describing the synthetic.
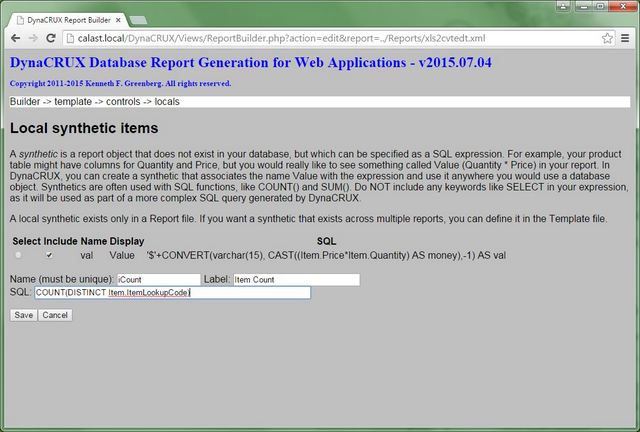
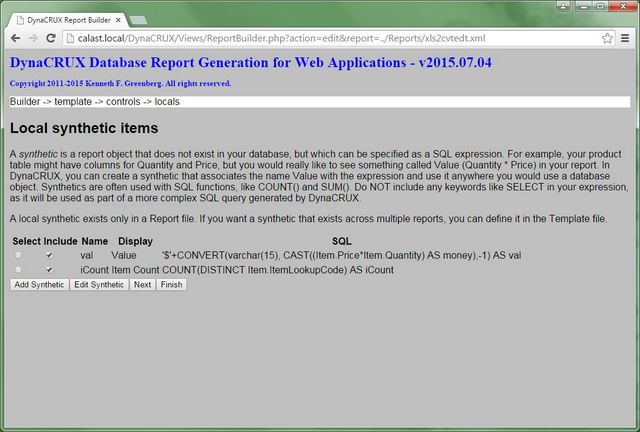
When you click on Save, it will be added to the table. Any local synthetics you define here will be available when specifying datasets so you can add them to your report.
Report Page and Title
We now move on to general information that applies to the entire report. DynaCRUX can produce several output formats. A new feature in version 2.0 is the ability to write to an existing web page. In earlier versions, the default behavior was to generate a very basic web page that contained your report output. If you want to write your report to part of an existing web page, you can now to that instead. Pages are stored on the server in the Pages directory. In this view, you can specify the name of an existing page in that directory, which will be stored in the report file. When the report is run, it will use that page for its output. You will need to specify destinations for various parts of your report within the page. A default page is provided, but it has no style information. It does contain appropriate areas for an old-style report.
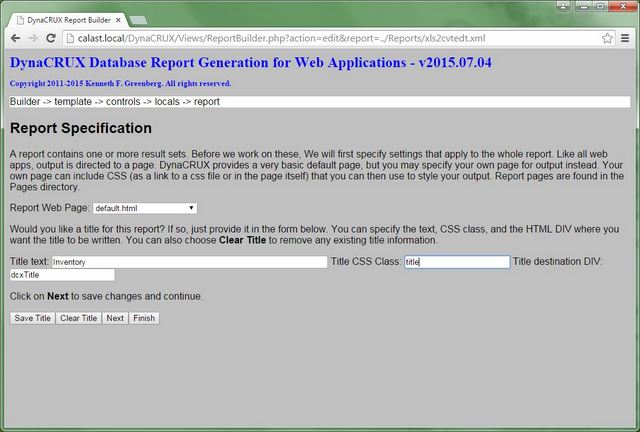
As we noted in Chapter 3, it's useful to have a title for your report, and DynaCRUX has a title directive to support this. It's very simple. You can also add a style for your title if you defined it in your CSS style sheet. If your report file contained title information, the form will be filled in with existing values. If not (or you are creating a new report), it will be blank. In addition to the title text and CSS class, you can specify the name of the DIV in the output page where the title should be written.
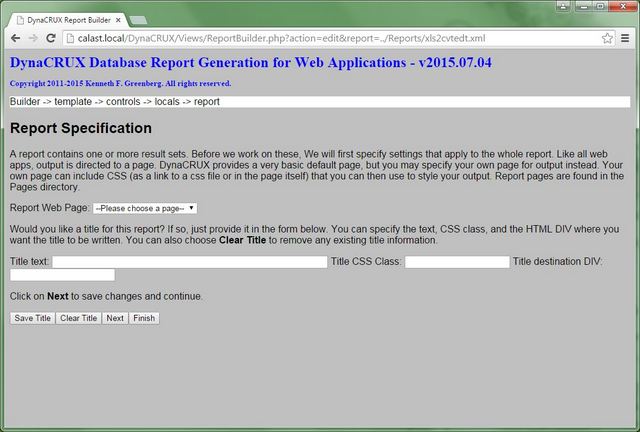
You can change the title information by filling in or editing the form and clicking Save Title. If you have a title and you want to get rid of it, click Clear Title to do so. If you don't click on Save Title, the form will be ignored. Here, we have specified the default web page, which automatically fills in the name of the title division for you. We then added a title and a title class.
When you are finished with your report specification, click Next to move on to the next view, or Finish to skip the remaining steps.
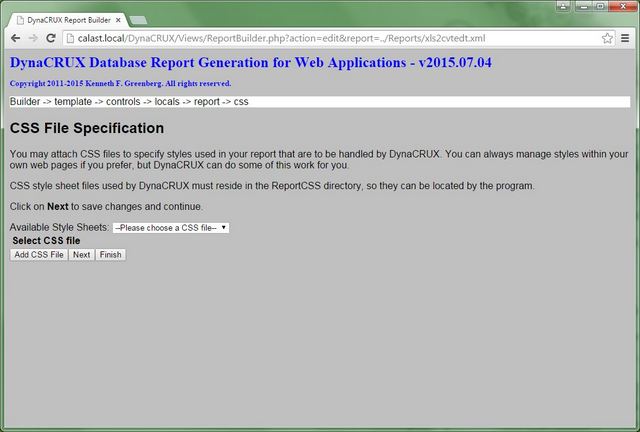
Adding a Style Sheet
As we noted back in Chapter 3, it's useful to specify a style sheet to make DynaCRUX reports look better, or to conform to the look and feel of your own web application. For example, using one font throughout your application and switching to a different one for DynaCRUX reports just makes things look unprofessional.
Since DynaCRUX is happy to conform to your own styles, all you need to do is provide an appropriate style sheet for your reports in the ReportCSS directory. You should upload any style sheets first, so Report Builder can find them.
At this point, you will be asked if you want to add any style sheets for this report. If you are editing an existing report, any style sheets found in it will already be shown on screen.
We want to add a style sheet names chezmoi.css here, so we choose it from the drop-down list and click on Add CSS File. It now appears in the style sheet table.
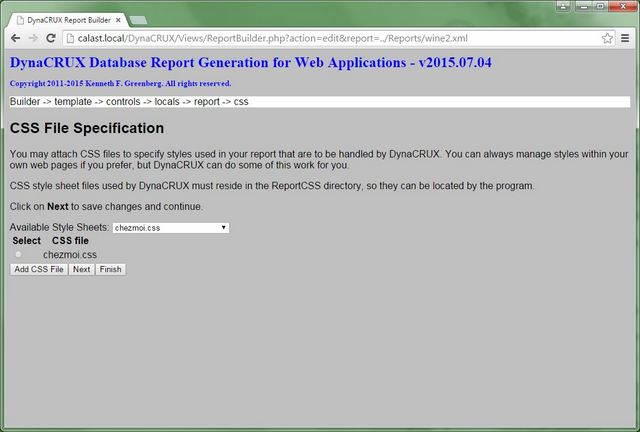
Since we only have one style sheet to add, we are done here. You can add as many style sheets as you need. Just keep selecting them and clicking on Add CSS File. The ones you have already chosen are shown on screen.
Click on Next to move on to the next section.
The Dataset Loop
As we have mentioned, a report must contain at least one dataset, corresponding to a database query and the results it returns. You can have as many datasets as you want, so Report Builder must process them one at a time. It starts out by collecting information about the dataset itself (like its name and display type) and then moves through a series of views that collect (or edit) information about the dataset.
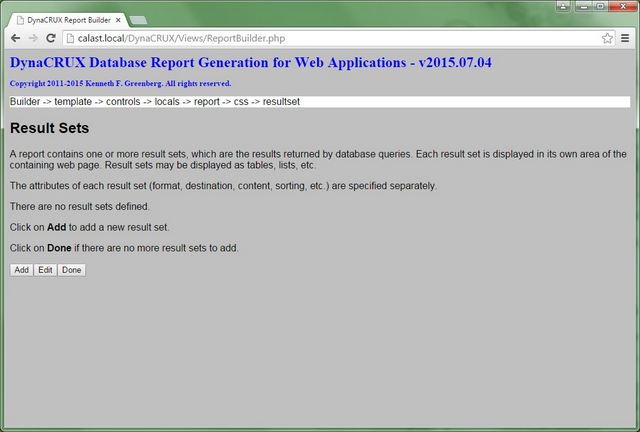
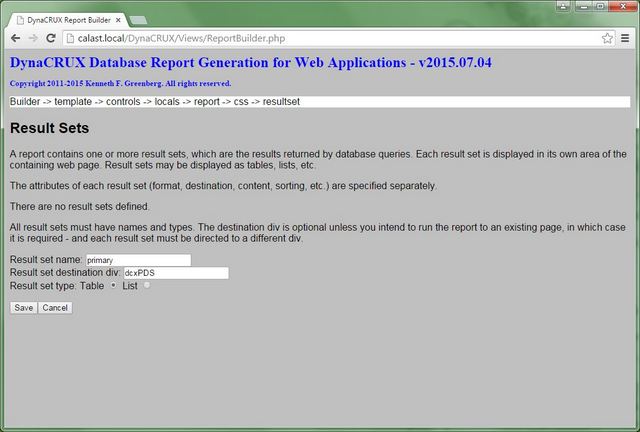
If you are designing a report from scratch, there will be no existing result sets. Note that in the above view, there is a note that tells you that there are no result sets defined so you will have to add one. Click on Add to reveal the form where you specify the name, destination div, and type (for now, either table or list). When you have filled in the form, click on Save to begin defining this result set.
If you are editing, there will be one or more in existence already. These are shown in a table.
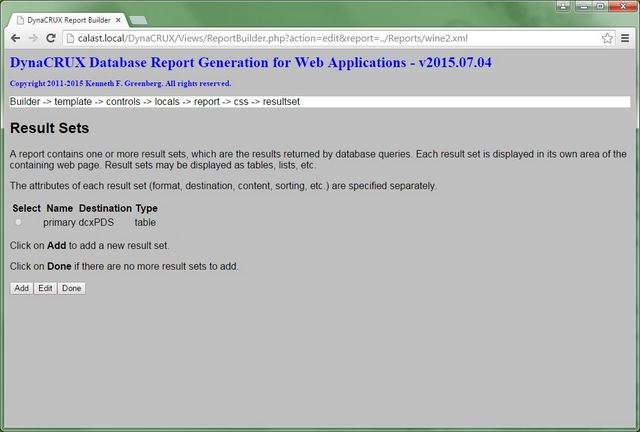
If you want to add another result set, you choose Add, just like in a new report. If you don't want to change any datasets, you can click on Done. But there must be at least one defined for the report to make sense. It is not possible to delete a dataset. To change an existing result set, you select it and click Edit. This brings up the form so you can review the name, destination and type. When these are correct, you click on Save to enter the loop. This allows you to modify the result set contents.
Item Selection
The first dataset step is to specify what information you wish to include in your result set. The choices presented here are based on the contents of the template file, plus any local synthetics. If you hand-crafted your template file, this will be a fairly short list. But if your template file was generated by generating it from SQL, it's likely to have a large number of items available. This part of Report Builder indicates the primary keys of tables, and (where known), the foreign keys. If you use numeric primary keys (as we do here), you probably won't be displaying them in your reports - although sometimes you have to. For example, in a billing system it would be normal to include invoice numbers, which would also be primary keys.
If the Schema Analyzer provided information about the types and widths of columns when you generated your template file, that information is provided as well to help you make good choices. If you are editing an existing report, then the objects it includes will be checked off for you. Of course, you may change them.
But, you should be aware that deleting an item previously included can have side-effects. When you delete a previously included item by unchecking it, all sorting, grouping, and column ordering information will be removed from the result set and will need to be specified again. There is a good reason for this. If you deleted the first sort key, any subsequent sort keys would be wrong. If you deleted a table column, any columns following that one would have the wrong column numbers. Thus, any deletion requires that you provide new attributes. Adding an item is not a problem, since it will simply show up as unsorted, ungrouped, and not shown. Of course, you will need to make adjustments in such a case, but there are no potential errors created by an addition.
Any local synthetics appear after the objects defined in the template, and have the table name "(local)." Local synthetics don't have types or widths.
To show you what this looks like, we'll go back to the wine list example we used in Chapters 2 and 3. Instead of hand-crafting the file, using Report Builder is much easier. But this example is based on a generated template, so it shows all the fields in the diagram back in Chapter 2. Here's what things look like, but note that quite a few fields are off the screen at bottom.
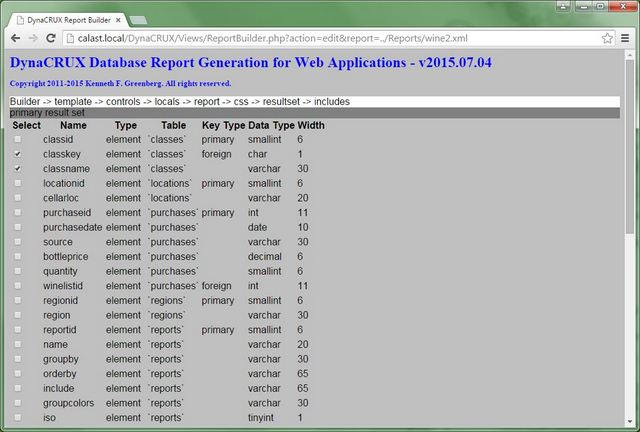
Operation of this part of the application in simple - you just choose the fields you want by checking the little boxes next to the fields you want. In our example, we needed eight fields:
- wine class key - the one used for sorting
- wine class name - the one used for printing
- varietal
- vintage year
- vintner
- label - e.g., the name of the chateau or the name of the vineyard
- region
- price
The names in the above screen shot are slightly different, because they were generated by the Schema Analyzer and not modified in Template Builder. But they are close enough to identify the eight boxes to check off. Please note that you have to check off not only those fields that will be displayed, but also those that are used for sorting but not displayed. The first item in the above bullet list is like that. It still needs to be included in the list of included information.
One further thing to note about local synthetics. Since they can be used in any dataset, the report builder can't really determine what you intended to do with them. So please be sure that you have set the checkbox for any local synthetics appropriately before leaving this view. If you want them to be in your dataset, they should be checked. If you don't want this (perhaps because you want them to be in a different dataset), then remove the check from the box before you click on Next.
Filtering
Each result set has its own query, and therefore requires that it have its own filters because those are used to build the WHERE clause of the query. Both types of filters are available: design-time filters from the template, and run-time filters from the controls section of the report, which we worked on previously. Once the included items have been determined, you will choose the filters to be applied.
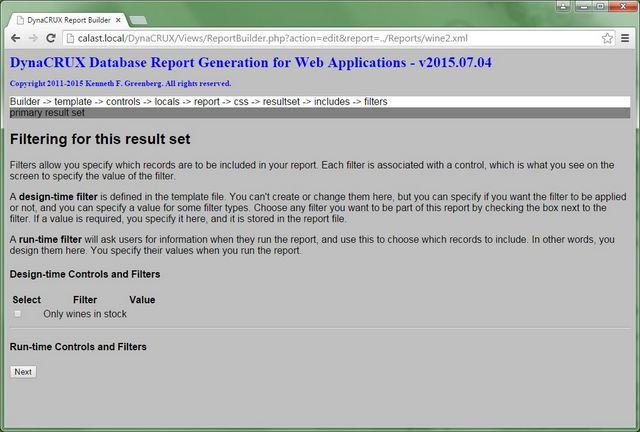
In the wine list report, we have only one design-time filter (in stock) and no run-time filters. Check the boxes for any filters you want applied to this result set and click Next.
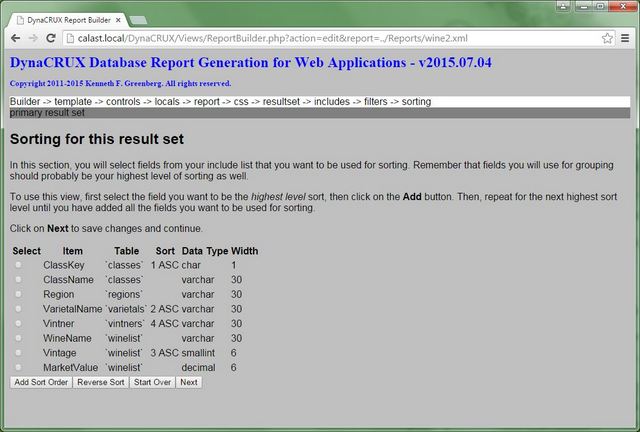
Sorting
In a DynaCRUX report file, sorting is just an attribute of an include list item. So when you have finished building your list of eight fields as above and specifying filters, you will be taken to another view where you see only the eight fields you have chosen. Here, you may specify the order in which things are sorted. We already have a good idea of how we want things sorted in our wine list - by classes, by varietals, by year, etc. Now we just have to tell Report Builder what we want. What you need to do is determine the order for your report, then pick items in order from the table and make them sort keys.
Sorting requires a bit of thought on your part. If you plan to use grouping, the grouping fields will probably be the first ones sorted. Beyond that, you probably have some ordering in mind for the report content. Those fields will be next.
This table is a selector table, not a checkbox table. It has radio buttons instead of checkboxes, so you can pick only one item at a time. The way you use this is to pick the first sort item (ClassKey in our example) by clicking on the button next to its name. Then click on the Add Sort Order button. The Sort column of the table will now have a "1" in it. Click on the next field (VarietalName) and click on the Add Sort Order button again to make this the second sort field. Continue until you have specified all the fields you want to sort on.
It would be unusual to sort on every field. We have chosen four, and the table has been updated to reflect this:
If you make a mistake, click on Start Over to erase your selections and begin again.
Sorting defaults to ascending order as noted by the entries like "1 ASC" in the table. Of course, sometimes you might want descending order instead. This is often the case with dates, where you want most recent first. To switch the order from ascending to descending (or vice-versa), select the sort key and click on Reverse Sort.
As expected, the sort column will be filled in for you if you are editing an existing report. If you have changed the contents of this table in a previous screen - for instance, deleting an existing item when editing a report - then all ordering information is deleted from the report, because it probably would not make sense any more.
Click on Next when you have established your sort order.
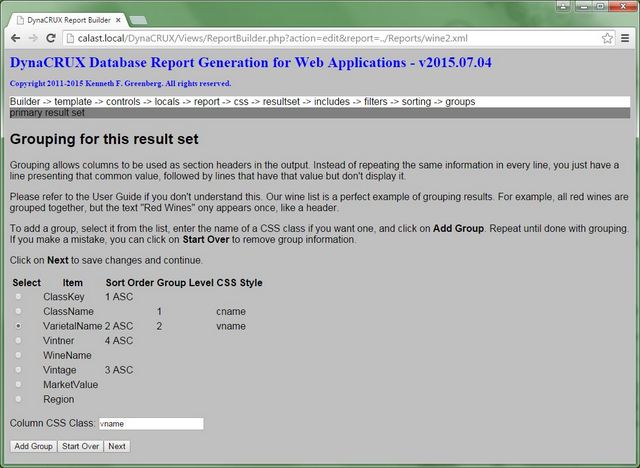
Report Groups
One of the first ideas we introduced back in Chapter 2 was grouping. Without grouping, a simple table would repeat column information for consecutive rows where the data did not change much. For example, if you had twenty white wines, they would all say "white wine" - not very informative. Grouping allows you to pull repeated data out of a table column and make it a header. So there would be one line that said "white wine" and twenty rows underneath it with details.
How do we specify this in a report? Report Builder has a view where you can see a list of all your selected items for the report under construction. We also show the sort order, as this will give you some clues about items that would be grouped together. To make one of these items a group item, you just click on it to select it, add an optional CSS class name to apply to the item when it gets displayed, and click on the Add Group button.
It's important to understand that you need to do this in order. That is, select your highest level of grouping first by clicking on the radio button next to it in the table. Then add an optional CSS class name (or clear the box if you don't want one applied). Then click on Add Group. If you want to add a second level of grouping, then click on the appropriate button and repeat the steps above. The order in which you select fields is the order in which they will be grouped.
For our wine list, we want to group by the wine class name. Remember that the class key field was a sort key. We needed to use that one for sorting in the proper order. But we won't even display that field in our report. Instead, we will display the associated class name, and this is our first level of grouping. We select it by clicking on the radio button next to the ClassName item in the table. We also want to apply a CSS class to this field, as described back in Chapter 3. You may recall that we defined this class as cname in our CSS file. So, we type cname into the box and click on Add Group.
Next, we want to add the second level of grouping, the varietal name. We repeat the process. Click on the radio button next to VarietalName, change the CSS class to vname to match the CSS file, and click on Add Group again.
If you make a mistake, click on Start Over to erase your selections and begin again.
You may note that if you are editing an existing report, there may be CSS style information in this table that has nothing to do with groups. These were stored in the incoming report file, and will be displayed anywhere that item appears in a table. These styles can be changed in the next screen, and can be safely ignored here.
We are now done with groups, so click on Next to continue. If you are editing an existing report and have no further changes to make, you can click on Finish to skip the remaining steps.
Report Presentation
In this section, we specify what your report will look like. The items that are not part of groups (see the previous section) are presented as columnar data in a table or as lines in a list. DynaCRUX lets you specify the order in which these appear in the columns section. If you choose to skip this section, then the columns will simply be presented in the order in which they appear in the template file. If you hand-crafted everything, this will probably work - but it's better to let the software do the work for you. This is also your opportunity to do some formatting of the information, beyond what CSS can do.
You have some other choices to make regarding presentation.
First, you may specify a CSS class to control the display style of this table or list. You do this by typing in the name of the class in the form. The class must be defined in your CSS file.
Second, you can choose which type of output you want. Mostly you will choose table, but if you wanted to have a result set consisting of a customer name and address (as for an invoice), then list is the right choice.
Third, you have control over how space is allocated to the table itself and to the various columns, as well as column alignment. If you are not familiar with CSS or how browsers render tables, we'll give you a brief overview.
By default, a browser renders (displays on the screen) a table based on content. That is, it knows what needs to be drawn in each column, including any column headers, and how much space they will take. It then lays out the table as appropriate to what it found. Each browser draws things slightly differently. But it will always be the case that if one column contains long strings of characters and all the other columns contain short strings, the "long string" column will just be wider.
What if things don't fit? Two things can happen - the table can just get wider, or lines will get broken up (on space boundaries) into two or more lines. This just makes the table row deeper, not wider. Of course, the table can get wider and the rows can get deeper if that's the only way to make things fit. The important thing to remember is that the browser has its own rules, subject to a few ways it can be constrained. The good news here is that it's always easier to let someone else (like the browser) do the work. The bad news is that every run of a report will probably look different, because the layout is based on different data.
Since most people find browser space allocation acceptable, this is the default.
DynaCRUX gives you an alternative. As you may have noted in the Sorting section, above, the maximum widths of most fields in your database are known in advance. If you generated a template using Template Builder, then your template will know those widths and display them on screen to guide you in laying out your table. If you click on the Use data sizes radio button, then this defines the table as auto mode. When you specify the table contents, DynaCRUX calculates the width of each column as a percentage of the total. Auto mode tells DynaCRUX to override the browser defaults and use these calculated percentages instead. This will probably make some columns have empty space in them, but they will always have a consistent layout.
Please note that some data types have unknown sizes; this applies to all local synthetics as well, since they are just formulas.
You are also allowed to specify your own explicit column widths (as a percentage) in the table. This is called user mode. You make that choice here, then specify how much space to allow for each column as a percentage.
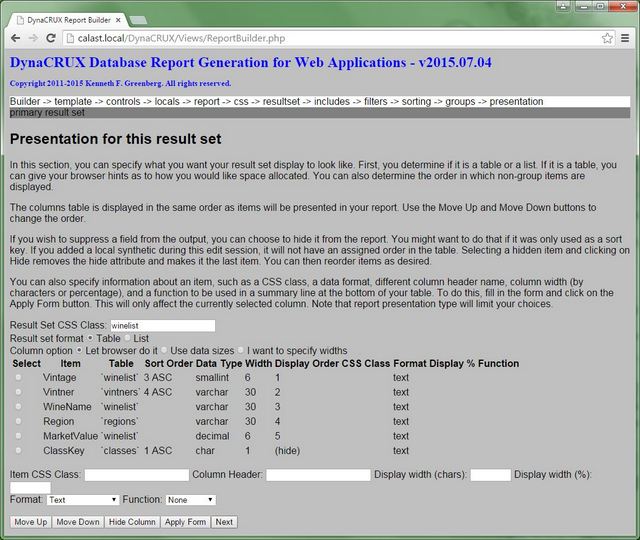
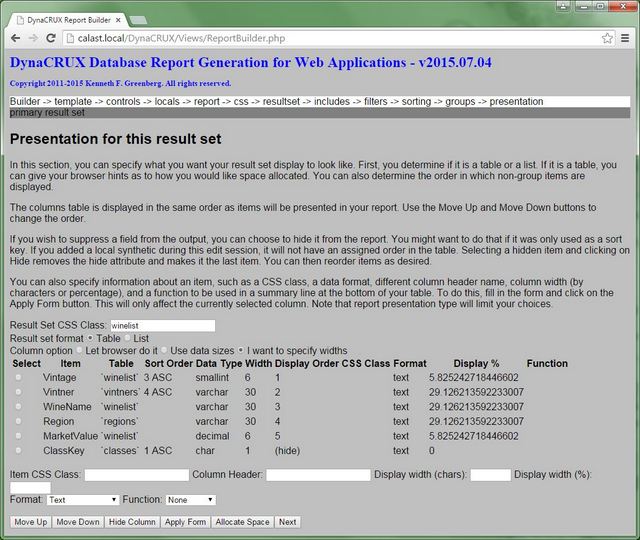
Let's look at the view that controls all this. In addition to some on-screen instructions, it has two sections. The first is about the type of report for this result set; the second is about individual items in the result set. The table of items will be filled in for you based on decisions you have made up to this point. This example is from a report that has been edited, so many of the decisions have already been made. Don't worry - we will take you through applying changes to a new report shortly.

Looking at the above screen shot, we see that:
- There is a CSS style winelist for the result set itself
- The result set will be presented as a table, so the style will be applied to the table node
- We will not try to give the browser any hints about column space allocation.
Once the report type information is as you want it, it's time to consider the columns themselves. Note that much of what we say about columns in tabular output also applies to lines in a list - but not everything. Lists have no space allocation or functions, for example.
At this point, it should be noted that this view is to some extent modal. What you see depends on what you had previously selected as report type: browser, auto, or user.
This view is also a bit more interactive than most others, so we will spend some time explaining how it works. You are first presented with a table showing the items you selected for inclusion in your report - minus the ones you already chose as grouping items. As with groups, this is a selector table. You choose one row of the table by clicking on its radio button, then do something with it. If you are creating a report from scratch, then the table will be arranged according to how things appear in your template file. This is also true if you deleted an existing item when editing, since all ordering is discarded when that happens. If you are editing an existing report and have not deleted any items, the order you specified before saving it will apply.
There are two things that you can do the items in this view:
- You can change the order of the columns to make more sense to your users
- You can modify the way an individual column is displayed
These actions are independent. Perform them in whatever order is convenient for you.
The buttons specify what you want to do with the selected item. (It is a row in this table, but will become a column in yours, so we will avoid these terms and just call them items.)
- Move Up changes the selected item to appear earlier in the order
- Move Down causes the selected item to appear later in the order
- Hide Column makes the item not appear in the output (or makes it reappear)
- Apply Form applies information from a simple form to the selected item
- Allocate Space (user mode only) recalculates how space would be allocated
- Next indicates you are finished with this view - and the result set
This is a great deal of information to digest, so let's start from a newly constructed report and try some changes.

This is a view of our wine list report as if we had just created it - no presentation information has been added. There is no information except column ordering, which was just assigned. This is necessary, as column ordering is required in a report file.
Moving and Hiding Columns
For our wine list, the ClassKey field was only used in sorting - we don't really want to see it in the report output. So, we select it and click on Hide Column. This moves it to the bottom of the table. Moving or hiding an item causes the table to be redrawn. Updating (Apply Form) just changes the item in place. We also typed in the result set CSS class winelist so we don't forget to assign it later.

Note that Column Order for ClassKey now indicates (hide), meaning that this data won't be included. Also, all the other items have been renumbered, and maintain their proper order - so far. But this order is not correct for our wine list. We want Vintage to be the first column, so we click on it to select, then click on Move Up until it reaches the top of the table.

The table has been updated to reflect that Vintage will appear as the first column in the table. Every time you click on Move Up, the table gets resorted. For now, you have to keep selecting the item using the associated radio button before each click.
We now pick the second column, Vintner, and repeat this operation. Then we do the rest of the columns (WineName, Region, and Price) in order. Here is the table with the columns as we wish to see them.
Changing the Table Appearance
The small two-line form near the bottom of the page is used to modify one of the items. The details that you can specify are:
- Item CSS class - assigns a known CSS class to this column
- Column Header - this lets you change the name of the column for this report
- Display width (chars) - this allows you to manually control table format by changing the display width of a column
- Display width (%) - this allows you to manually control table format by assigning a percentage to each column
- Format - you can specify output to be in some other format besides plain text - see below
- Function - you can specify a function to apply to the column data
This last item needs some explanation if you have not used it before. DynaCRUX provides you with the option of having a "totals" row appended to your results table. For any numeric column (either number or usd), you can specify a function to be applied to that column. If any functions are specified, then a totals row will be added. The results of applying the function for each column that has one will appear in the extra row.
Based on the report type you specified, some of the width choices will not be available to you. If you selected browser, then no column width is output to the report file since the browser is determining layout. Thus, neither width field is available since they would not be written to the output file anyway. If you specify auto, then you can change the column width in characters. If you specify user, then you can change the space allocation by percent.
Here is a view of our wine list of we had specified user space allocation:
To reach this point, we clicked on "I want to specify widths" in the top part of the view. This added the Allocate Space button, which we then clicked on to fill in the percentages in the table. This will give you a rough idea of what your report might look like. Once you have allocated space manually, this is no longer presented - you will see your allocation instead. You can leave things as they are, or you can edit each item to give it the percentage of the table that you like - say, changing the three columns shown to 30 instead of 29 and a fraction. If you don't like the space allocation, you can reset it to the calculated values using the Allocate Space button.
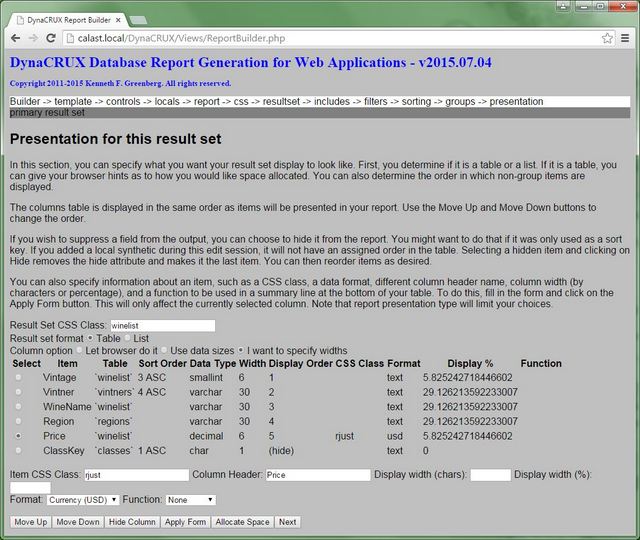
To change anything, you choose an item by clicking in its radio button, fill in the form, and click on the Apply Form button in the button bar at the bottom. We will now change the name "MarketValue" to Price, add a CSS class to it, and specify that we want Currency (USD) from the format control. The style called rjust is defined in the CSS file as right-aligned data. Make sure that the CSS Class text box is either empty (if you don't want any CSS for the data) or has a proper name. The default format from the list is text, but you have some other choices. These will grow over time, but you can specify boolean data to be displayed as a check box, dates to be in a few different styles, etc.
Here's the table after selecting MarketValue, filling in the form, and clicking on Apply Form. Note that the column name has changed to Price.
Before we leave this topic, we should spend some time on the format and function drop-down lists. Be default, the format is just text. This works fine for most things, but there are times you want your column to contain text with some formatting, or maybe contain something other than text. At present, the selection is somewhat limited, but expect it to grow over time. These are the current options.
- Text - the default - just displays whatever was in the database as text
- Number - display either integer or floating point numbers, allows functions
- Currency (USD) - displays a numeric value as US dollar currency; i.e., 2.5 would be displayed as $2.50
- Date (Y-m-d) - displays a date; March 5, 1980 displays as 1980-03-05
- Date (m d y) - displays a date; March 5, 1980 displays as Mar 5, 1980
- Checkbox - displays a binary value as a checked or unchecked box in the table
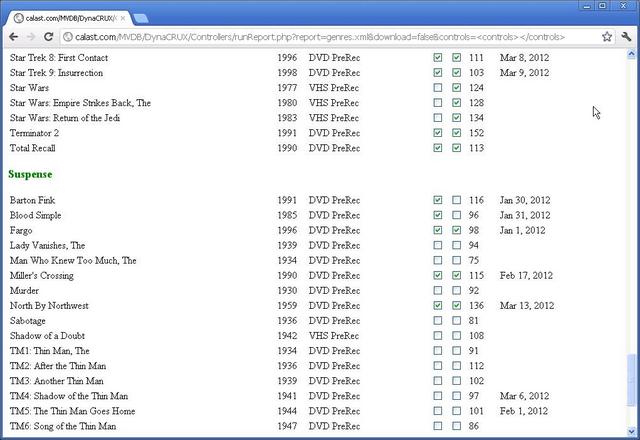
Here is a view of report output that shows some of the above formats. This is a list of film titles, release year, media, two checkboxes (wide screen and surround sound), length of the film in minutes, and last watched date.
If you have chosen either usd or number as a format, you can apply a function to the column data. This will cause the result of the applied function to appear in an extra row appended to the table. If no column has a function applied, then the row is not produced. The function choices are:
- Sum
- Count
- Average
- Minimum
- Maximum
Report Builder will not let you apply these functions unless the data type is appropriate.
When you are done with columns, click on Next to continue. This will take you back to the top of the result set loop. Here, you can add another result set, edit one of the existing ones, or click Done to exit the loop.
Choosing What to Do Next
Now that your report has been defined, you have to decide what you want to do next.
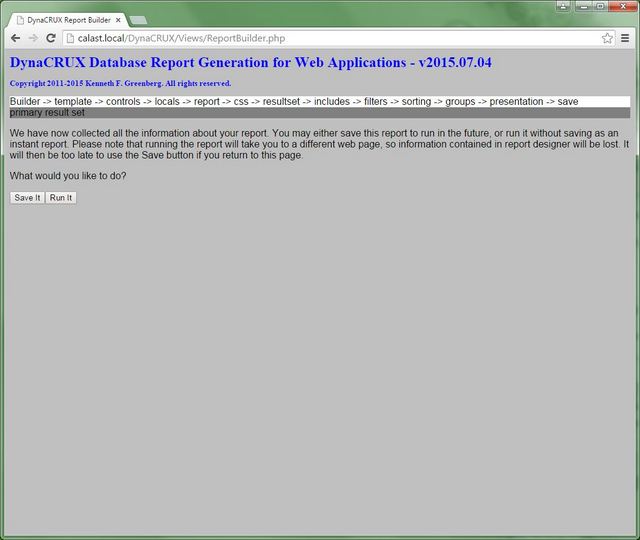
If this is a report that you will want to run regularly, then click on Save It to write a report file to your Reports directory. (In the future, you will also be able to store it in your database if you prefer.)
On the other hand, perhaps you are just trying to get a quick answer to some question that can best be determined by generating and running a query against your database. In that case, you don't need to save the report at all, so click on Run It instead. Of course, the XML that defines the report is really saved somewhere - it's just placed in a temporary file.
One important consideration here is that you cannot really do both. When you click on Run It, another web page will be loaded. All of the memory content associated with Report Builder will be lost. So if you return to this page with the back button, you can't use the Save It button because that information is no longer available. However, if you run an instant report to test it and you like what you see, you are given the option to save it at that point.
In the next chapter, we will discuss running the report. It's the same for saved and instant reports.
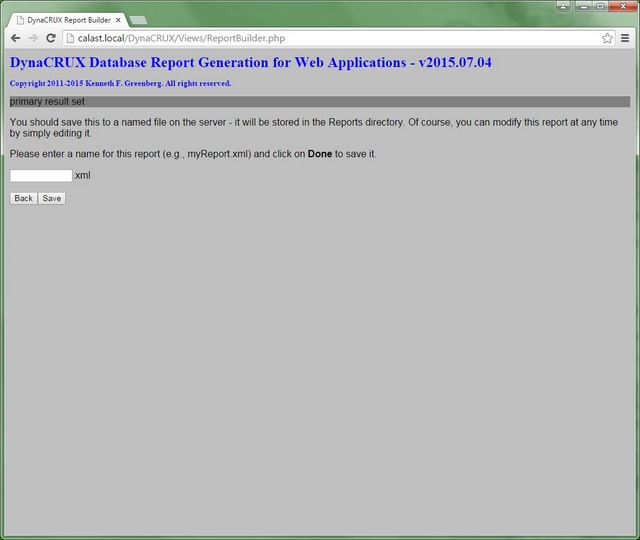
Saving the Report File
If you chose Save It, you will now be prompted for the name of this report. The screen includes the ".xml" suffix, so you know not to include that in your report name. That is, entering "winelist" will create a file called "winelist.xml" in the Reports directory on the server. Click on Save to save it and end the report design application. The DynaCRUX GUI checks to see if a file by this name already exists. If so, then you will be asked to confirm that you really want to overwrite it.
The report will now appear in the list of reports that can be run, as will be described in Chapter 7 - Running a Report. We will also discuss running instant reports there, even though they are run inside of Report Builder.